Contents
Introduction
The Council’s financial year runs from 1 April to 31 March, with work to set the following year’s budget beginning each October. As part of this process, the residents and businesses were invited to share their views on local priorities and the future of Council services.
Purpose of the engagement
This survey was open to all residents of Bassetlaw and interested participants and ran from 12 November 2025 to 24 December 2025. It asked respondents about their satisfaction with their local area and the Council, their views on how the budget should be balanced, and whether specific Council services should be funded, reduced or stopped, or transformed to deliver cost savings.
Response breakdown
- Valid responses - 455
- Margin of error - 4.5%. Population of 117,800, 95% confidence.
Respondent profile
- Live in Bassetlaw: 95.6%
- Male: 54.8% | Female: 43.4%.
- Not disabled: 78.3% | Disabled: 16.7%
- Ethnicity: 93.5% White English, Welsh, Scottish, Northern Irish or British
- Most common age bracket: 65 and over - 51.7%
What does this mean?
A total of 455 valid responses were provided to the survey and included in the analysis. Data was cleaned, and invalid or unusable responses were removed prior to analysis.
The margin of error tells you how much the survey results might differ from the true views of the entire population. With a 4.5% margin of error, any percentage reported in the survey could reasonably be 4.5 points higher or lower than what we found. The Margin of error assumes a random sample, which this research did not use, so the margin should be interpreted with caution. Demographic information such as sex, age and ethnicity was also collected to monitor the profile of respondents completing the survey.
Key Findings
- Satisfaction with the local area and Bassetlaw District Council has increased since 2024
- People feel increasingly well-informed about services provided by BDC
- Strong preference for organisational change and efficiency measures
- Respondents strongly favour Transforming Services and effective Asset Management over other budget savings options
- Different services should consider distinct ways of balancing the budget
- Service Awareness and Usage is varied
Satisfaction with the local area and Bassetlaw District Council has increased since 2024
67.5% of residents report they are very or fairly satisfied with their local area as a place to live, an increase of 2.6 percentage points from the 64.9% recorded last year.
51.9% of respondents say they are very or fairly satisfied with the way the Council runs things, an increase of 4.7 percentage points from the 47.2% recorded last year.
People feel increasingly well-informed about services provided by BDC
64.2% of respondents say they are very or fairly well informed about the services and benefits provided by Bassetlaw District Council, an increase of 5.2 percentage points from the 59% recorded last year.
Strong preference for organisational change and efficiency measures
53% (112) of comments indicated a wish for the council to change how it operates and deliver efficiencies to match budget requirements. Suggestions on changes included: reduction in staff or councillor costs, transformation or digitisation of services, improved collaboration and sharing of services, and improved procurement and contractor oversight.
Respondents strongly favour Transforming Services and effective Asset Management over other budget savings options
Respondents very strongly favoured transforming services and asset management as ways to balance the budget over other options, when asked to rank them.
Different services should consider distinct ways of balancing the budget
People are more likely to favour the running of the council being transformed (49.8%) than services such as leisure and culture (26.3%), and property and estate management (25.9%). People are more likely to favour increases in council tax being used to fund Waste and Recycling services (30.5%), and services supporting our communities (22.4%). Raising the level of fees and charges is more favoured in Leisure and Cultural Services (27.7%) and Business and Skills (20.6%).
Service Awareness and Usage is varied
Confusion was evident regarding which organisations are responsible for different services. In respect to usage of BDC services, 82.5% of respondents say they use Waste & Recycling services ‘Very Often’ or ‘Often’, while comparison, 79.1% of respondents say they use Business and Skills services ‘Never’ or ‘Rarely’.
Full Analysis - Living in Bassetlaw
As part of the survey, respondents were asked about their satisfaction with their local area as a place to live, their satisfaction with the way Bassetlaw District Council runs things, and how well informed they feel about the services and benefits the Council provides. These questions were included to help assess overall perceptions of the district, the Council, and gauge how effectively information about services is reaching residents.
- Satisfaction with the local area and Bassetlaw District Council has increased since 2024
- People are increasingly well informed about the services and benefits provided by Bassetlaw District Council
Satisfaction with the local area and Bassetlaw District Council has increased since 2024
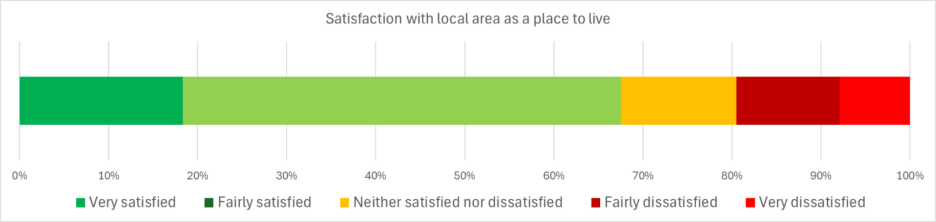
Satisfaction with local area as a place to live
67.5% of residents report they are very or fairly satisfied with their local area as a place to live, an increase of 2.6 percentage points from the 64.9% recorded last year.
The table below presents only respondents who indicated they live in Bassetlaw. Using LGA methodology, don’t know responses (2) have been excluded from the above percentages.
| Response | Number | Percentage |
|---|---|---|
| Very satisfied | 79 | 18.3% |
| Fairly satisfied | 212 | 49.2% |
| Neither satisfied nor dissatisfied | 56 | 13.0% |
| Fairly dissatisfied | 50 | 11.6% |
| Very dissatisfied | 34 | 7.9% |
| Total | 431 | 100% |
People are increasingly well informed about the services and benefits provided by Bassetlaw District Council
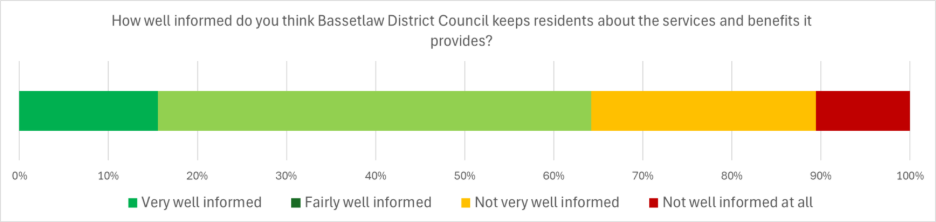
How well informed do you think Bassetlaw District Council keeps residents about the services and benefits it provides?
64.2% of respondents say they are very or fairly well informed about the services and benefits provided by Bassetlaw District Council, an increase of 5.2 percentage points from the 59% recorded last year.
Using LGA methodology, a 4‑point ordinal scale is used for this question. Don’t know responses (10) have been excluded from the below percentages.
| Response | Number | Percentage |
|---|---|---|
| Very well informed | 69 | 15.5% |
| Fairly well informed | 216 | 48.6% |
| Not very well informed | 112 | 25.2% |
| Not well informed at all | 47 | 10.6% |
| Total | 444 | 100% |
Full Analysis - Balancing the Budget
Respondents were advised that the Council has several ways it can balance its budget and were asked to rank the following options in order of preference:
- Raising the level of Council Tax
- Raising the level of Fees and Charges
- Reducing or stopping services
- Transforming services – providing services in a different way, for example by working with partners or increasing efficiency
- Effectively managing our assets – including reducing the costs of running Council buildings, changing how they are used and managed, or selling some property
The findings of the responses are presented below.
- Transform services and manage assets to balance the budget
- Respondents preferred 'transform these services to make savings' over reducing or stopping services
- Business and Skills
- Leisure and Cultural Services
- Supporting our Communities
- Waste and Recycling
- Running the Council
- Strong preference for organisational change and efficiency measures
- Waste and Recycling is the most used Council service
- Social Care, Roads and Police misidentified as BDC responsibility
- Survey Sample
- Age
- Characteristics of respondents
Transform services and manage assets to balance the budget
Respondents clearly favoured transforming services and asset management as ways to balance the budget over other options, when asked to rank them.
- Raising the level of Council Tax - 11%
- Reducing or stopping services - 11%
- Raising the level of fees and charges - 13%
- Effectively managing our assets - 81%
- Transforming services - 33%
Note: the information above represents top two most preferable choices and sums 200%.
When asked about other ways to balance the budget, comments fell into 3 categories:
- 50% (107) of comments suggested making cuts to save. “Cut spending and become more efficient. There is too much waste of money in local and national government.”
- 31% (65) of comments suggested making or encouraging investments to grow or save. “Inward investment … use the Freeport status to drive interest and activity. Improve housing stock, town centre and transport to attract people to the region.”
- 9% (19) of comments suggested increasing charges or tax, in line with this being the least preferred option when it comes to balancing the budget “Increase council rents to market rates.”
| Raising the level of Council Tax | Reducing or stopping services | Raising the level of fees and charges | Effectively managing our assets | Transforming Services |
|---|---|---|---|---|
| 7% | 6% | 4% | 43% | 40% |
| 4% | 5% | 9% | 38% | 43% |
| 14% | 24% | 42% | 9% | 11% |
| 28% | 19% | 41% | 7% | 4% |
| 47% | 45% | 4% | 2% | 2% |
Respondents preferred 'transform these services to make savings' over reducing or stopping services
Respondents were asked which way the council should use to fund services.
Across all service areas, respondents preferred ‘transform these services to make savings’ over reducing or stopping services.
A secondary theme is a willingness to reduce the costs of running buildings and/or dispose of surplus property, with this option as leading preference within Property and Estate Management, and contender in several other Service areas.
Way the Council should fund services
| Service | Raising the level of Council Tax | Raising the level of fees and charges | Reduce / stop some of these services to save money | Transform these services to make savings | Reduce costs of running its buildings / or sell | Don't know |
|---|---|---|---|---|---|---|
| Business and skills | 4.4% | 20.6% | 15.9% | 29.9% | 22.6% | 6.5% |
| Leisure and Cultural Services | 18.2% | 27.7% | 6.7% | 26.3% | 18.0% | 3.2% |
| Supporting our Communities | 22.4% | 13.1% | 9.3% | 36.4% | 13.8% | 5.1% |
| Waste & Recycling | 30.5% | 14.7% | 2.8% | 35.2% | 13.1% | 3.7% |
| Property & Estate Management | 6.4% | 16.3% | 8.5% | 25.9% | 39.6% | 3.3% |
| Running the Council | 9.9% | 4.2% | 13.6% | 49.8% | 16.4% | 6.2% |
People feel that different approaches should be taken to balancing the budget in each service. People are more likely to favour the running of the council being transformed (49.8%) than services such as leisure and culture (26.3%), and property and estate management (25.9%). People are more likely to favour increases in council tax being used to fund Waste and Recycling services (30.5%), and services supporting our communities (22.4%). Raising the level of fees and charges is more favoured in Leisure and Cultural Services (27.7%) and Business and Skills (20.6%).
The strongest preference for funding each service grouping is shown below:
- Business and skills – transform (29.9%)
- Leisure & Culture – raise fees (27.7%)
- Supporting our communities – transform (36.5%)
- Waste & Recycling – transform (35.2%)
- Property & Estate Management – reduce building costs (39.6%)
- Running the Council – transform (49.8%)
Business and Skills
Support to local businesses, Retford Enterprise Centre, Middleton's Yard, The Bridge Skills Hub, and Markets. Respondents mostly agreed that the Council should transform these services to make savings (29.9%), followed by the Council should reduce the costs of running its buildings and/or sell off some of its property to fund these services (22.7%)
The least popular option was “These services should be mainly funded by raising the level of Council Tax” (4.4%).
Leisure and Cultural Services
Parks and Open Spaces, Allotments, Splash Pools, Museum and Leisure Centres.
Respondents were equally split in this question between raising the levels of fees and charges (27.7%) and transforming these services to make savings (26.3%).
The least popular was ‘The Council should reduce or stop some of these services’ (6.7%).
Supporting our Communities
Community Safety, CCTV and Anti-Social Behaviour, Environmental Health, Strategic Housing and Homelessness, Licensing, Planning & Building Control, Customer Services, Policy & Communications, Council Tax and Business Rates collection, and Benefits.
Respondents mostly agreed that the Council should transform these services to make savings (36.4%), followed by raising the level of Council Tax (22.4%).
The least popular was ‘The Council should reduce or stop some of these services’ (9.3%).
Waste and Recycling
Bin collections, Street Cleaning, and Fly-Tipping.
Respondents were equally split in this question between transforming services to make savings (35.2%) and raising the level of Council Tax (30.5%).
The least popular was ‘The Council should reduce or stop some of these services’ (2.8%).
Village, Industrial Estates and Units, and Commercial assets.
Respondents mostly agreed that the Council should reduce the costs of running its buildings/ sell (39.62%). This was followed by transforming these services to make savings (26%).
The least popular answer was ‘mainly funded by the raising the level of Council Tax’ (6.4%).
Running the Council
Finance, Legal Services, IT, HR, Democratic Services and Elections.
Respondents mostly agreed that the Council should transform services to make savings (49.8%). The rest of the responses were equal, with the next being reduce the costs of running its buildings/ sell (16.4%).
The least popular answer was ‘funded by raising the levels of fees and charges’ (4.2%)
Strong preference for organisational change and efficiency measures
Overall, 53% (112) comments indicated a wish for the council to change how it operates and deliver efficiencies to match budget requirements. Most commonly:
- 33% (70) of comments called for a reduction in staff or councillor costs, pensions and/or expenses.
- 16% (35) of comments called for transformation or digitisation of services to be more efficient and delivery-focused.
- 11% (24) of comments called for improved collaboration and sharing of services within the Councils and with neighbouring authorities.
- 8% (17) of comments called for improved procurement and contractor oversight, including the reduced use of contractors.
- 34 (16%) of these comments covered more than one of these aspects, suggesting wide-ranging changes to council operations and structure.
Together, these account for 25% of total responses, including respondents that did not make any comment. Commenters are often more engaged with the topic and may hold views more strongly than those who choose not to comment.
Waste and Recycling is the most used Council service
Respondents were asked how often they used the following Council Service groupings: Business & Skills, Leisure and Cultural Services, Supporting our Communities, Waste & Recycling, Property & Estate Management, Running the Council.
82.5% of respondents say they use Waste & Recycling services ‘Very Often’ or ‘Often’.
In comparison, 79.1% of respondents say they use Business and Skills services ‘Never’ or ‘Rarely’.
| Service | Never | Rarely | Occasionally | Often | Very Often | Don't Know |
|---|---|---|---|---|---|---|
| Business & Skills | 60.1% | 18.9% | 14.1% | 4.4% | 1.5% | 0.9% |
| Leisure & Cultural Services | 14.3% | 22.0% | 31.28% | 18.9% | 13.2% | 0.2% |
| Supporting our Communities | 26.9% | 34.2% | 26.2% | 6.2% | 3.3% | 3.1% |
| Waste & Recycling | 1.3% | 2.7% | 13.1% | 28.8% | 53.6% | 0.4% |
| Property & Estate Management | 22.6% | 26.6% | 30.1% | 14.2% | 4.9% | 1.8% |
Social Care, Roads and Police misidentified as BDC responsibility
14% (29) of comments raised an issue that was a responsibility of a different organisation, often attributing these issues to BDC. Examples include Social Care, Roads and Police /Police and Crime Commissioner.
This theme was also identified in face-to-face engagement with residents through Bassetlaw Conversations, where 23% of recorded interactions focused on NCC business, rather than BDC responsibilities. A key motivator and aim of Local Government Reorganisation is to reduce this confusion.
The survey sample is skewed toward older age groups, with over half of respondents aged 65 and above
Age
Older age groups are overrepresented, with 51.7% aged 65 and over, therefore findings should be interpreted with caution. Due to the voluntary nature of the survey, the sample is not demographically representative in respect to age. The survey was delivered digitally and promoted across social media to broaden its reach and encourage participation from all age groups. While this approach helped extend visibility, the final sample still shows a strong overrepresentation of older respondents.
| Age Group | Percentage |
|---|---|
| 65 and over | 51.7% |
| 55-64 | 25.5% |
| 45-54 | 12.1% |
| 35-44 | 3.2% |
| 18-24 | 1.2% |
Characteristics of respondents
The survey was slightly over‑representative of male respondents, who accounted for 54.8% of the sample. A total of 16.6% of respondents identified as disabled, broadly aligning with Census 2021 data indicating that 19.6% of Bassetlaw’s population reports a disability under the Equality Act definition. In addition, 93% of respondents identified as English, Welsh, Scottish, Northern Irish or British, which is consistent with Census 2021 figures.
| Sex | Percentage |
|---|---|
| Female | 43.4% |
| Male | 54.8% |
| Prefer not to say | 1.8% |
| Answer to the question "Do you consider yourself disabled?" | Percentage |
|---|---|
| Yes | 16.7% |
| No | 78.3% |
| Prefer not to say | 5.0% |
| Ethnicity | Percentage |
|---|---|
| White English, Welsh, Scottish, Northern Irish or British | 93.5% |
| Other White background | 1.6% |
| Other | 1.3% |
| Prefer not to say | 3.6% |
| Connection to Bassetlaw | Percentage |
|---|---|
| I live in Bassetlaw District | 95.6% |
| I work in Bassetlaw but live in another area | 2.6% |
| I visit Bassetlaw | 1.1% |
| I represent a community organisation in Bassetlaw | 0.2% |
| I represent a business in Bassetlaw | 0.4% |
Most people completing the survey lived in Bassetlaw (95.6%) with a small number of people responding from outside the District.
Last Updated on Thursday, June 18, 2026